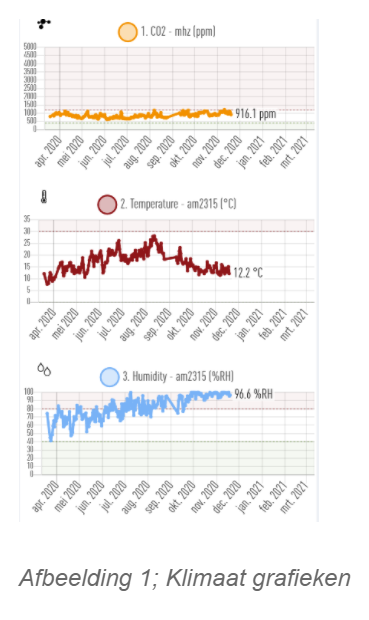
Min/max values in the graphs
Healthy indoor climate for people and animals
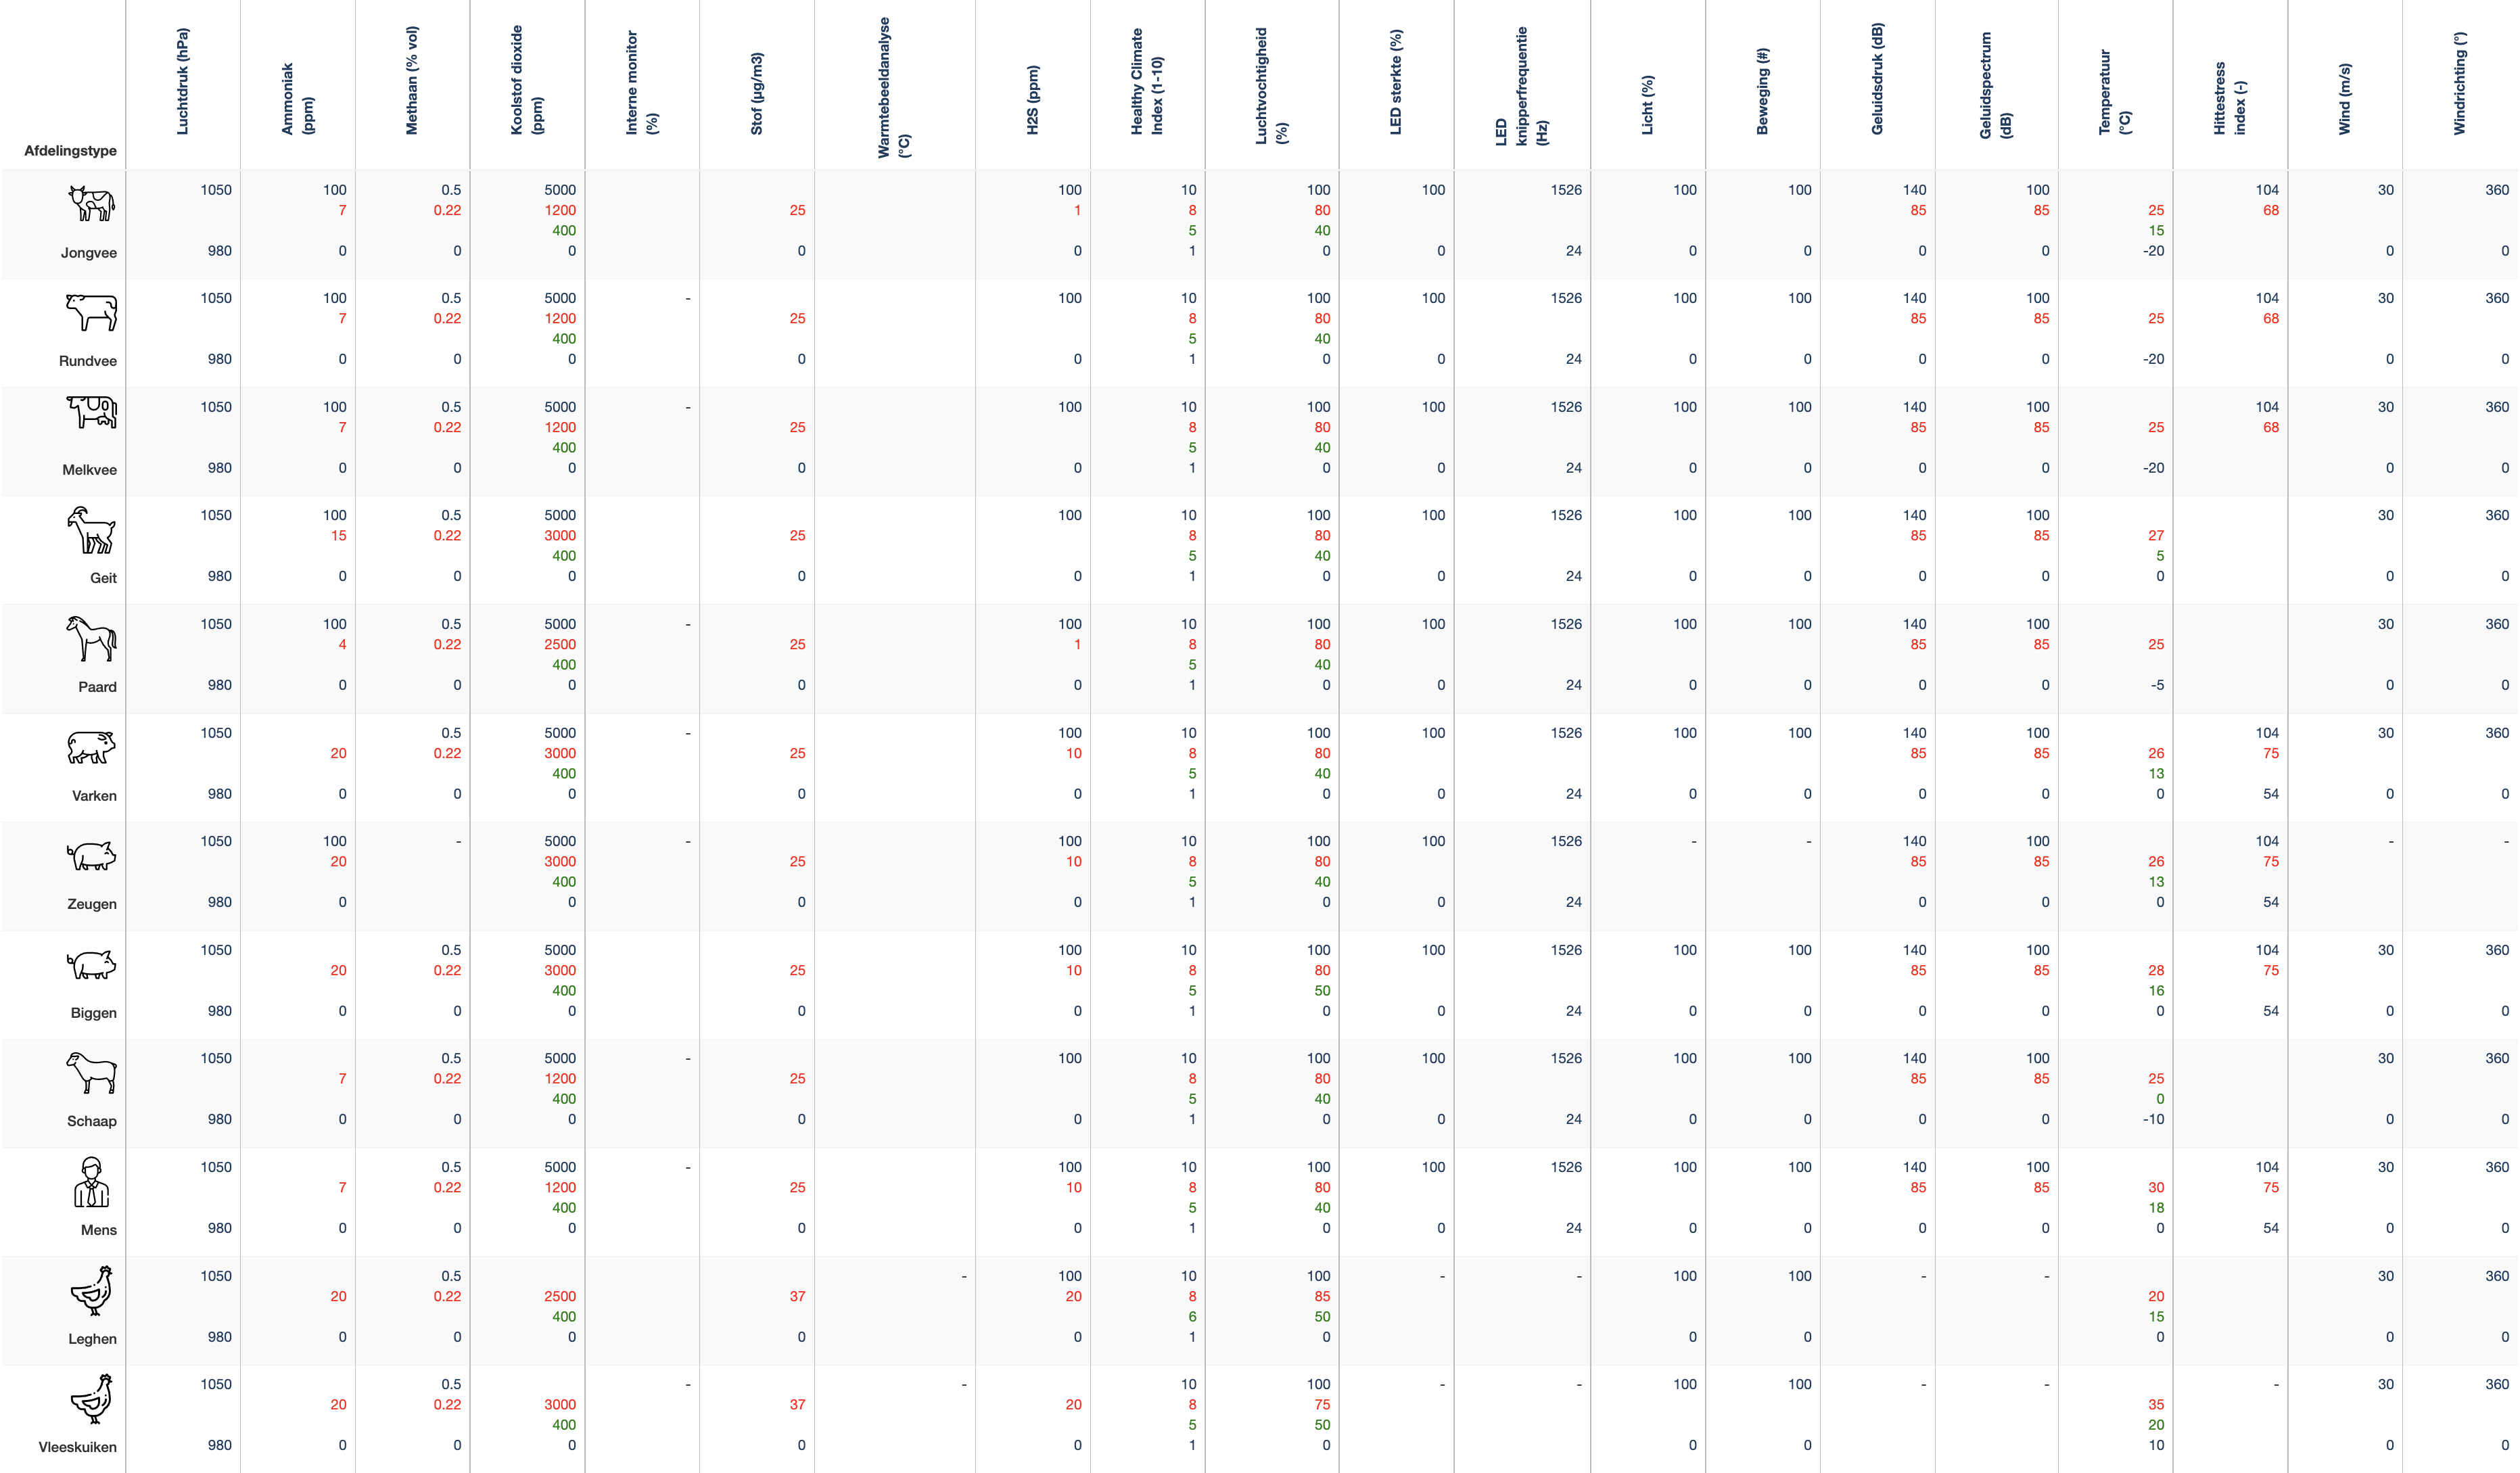
A healthy indoor climate is important for animal health. To analyse the indoor climate, the climate limit values for each animal group were examined. These climate limit values per animal species can be found in the table below.
In the HCM app, the human climate limit values are used by default in the graphs. If you specify which animal group is being monitored in a study, the figures and limit values for this animal group will be shown on the right. The green line indicates the minimum value and the red line represents the maximum value. See image below.